Workplace Analytics Platform
Workplace Analytics Platform
Optimizing Office Utilization Through Data-Driven Intelligence
Optimizing
Office Utilization Through
Data-Driven Intelligence
Optimizing Office Utilization Through
Data-Driven Intelligence
My role
My role
As Lead Product Designer at Locatee, I was responsible for transforming their workplace analytics platform through multiple strategic initiatives. Working closely with a cross-functional team, I led the end-to-end product research and design process to enhance data visualization, improve usability, and create new high-value features that expanded the platform's capabilities and business value.
Scope
User Research
UX Design
UI Design
Design System
Documentation
Team
1 Lead Product Designer
1 Frontend Dev
1 Backend Dev
1 Data Scientist
About Locatee
About Locatee
Locatee is an innovative Swiss-based PropTech company that has revolutionized workplace management through its advanced SaaS analytics platform.
Founded in 2014, the company has emerged as a leader in the workplace intelligence sector, providing data-driven solutions for corporate real estate professionals worldwide.
Currently acquired by Tango.


Project
Team Analytics
paid add-on
Problem
Space utilization data lacked team context, preventing organizations from connecting workspace design with team performance. Customers needed insights beyond physical metrics to make decisions that would impact productivity.
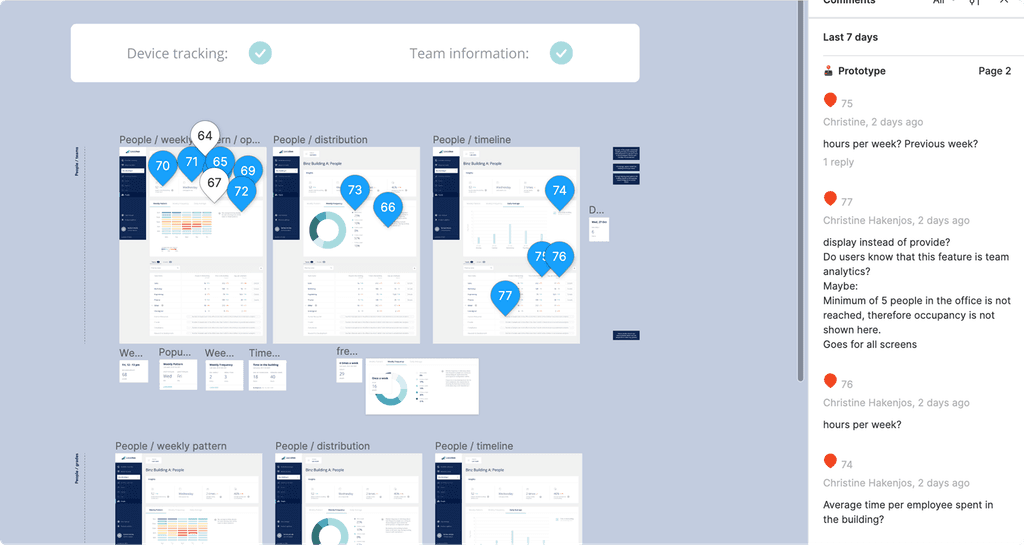
Solution
Developed Team Analytics as a premium add-on that connected workplace data with organizational structure. Created team-specific dashboards, comparative analysis tools, and trend visualizations that revealed the relationship between workspace arrangements and team effectiveness.
Result
Became a significant revenue driver as a premium feature. Customers reported more targeted workspace improvements and increased team satisfaction after implementing changes based on the analytics.
Problem
Space utilization data lacked team context, preventing organizations from connecting workspace design with team performance. Customers needed insights beyond physical metrics to make decisions that would impact productivity.
Solution
Developed Team Analytics as a premium add-on that connected workplace data with organizational structure. Created team-specific dashboards, comparative analysis tools, and trend visualizations that revealed the relationship between workspace arrangements and team effectiveness.
Result
Became a significant revenue driver as a premium feature. Customers reported more targeted workspace improvements and increased team satisfaction after implementing changes based on the analytics.
Project
Platform
UI Redesign
Problem
Locatee's interface had become dated and complex, with navigation challenges as new features were added. The utilitarian design failed to reflect the platform's sophisticated capabilities.
Solution
Led comprehensive UI modernization with a refreshed visual language, restructured information architecture, and improved accessibility standards. Created clear visual hierarchies to guide users through complex data.
Result
User satisfaction increased 28%, new user onboarding time decreased by 33%, and the modern interface became a valuable marketing asset that improved sales demo engagement.
Project
Data Actionability
& Transparency
Problem
Customers struggled to translate data insights into concrete actions. Users reported "data overwhelm" and uncertainty about how to prioritize information.
Solution
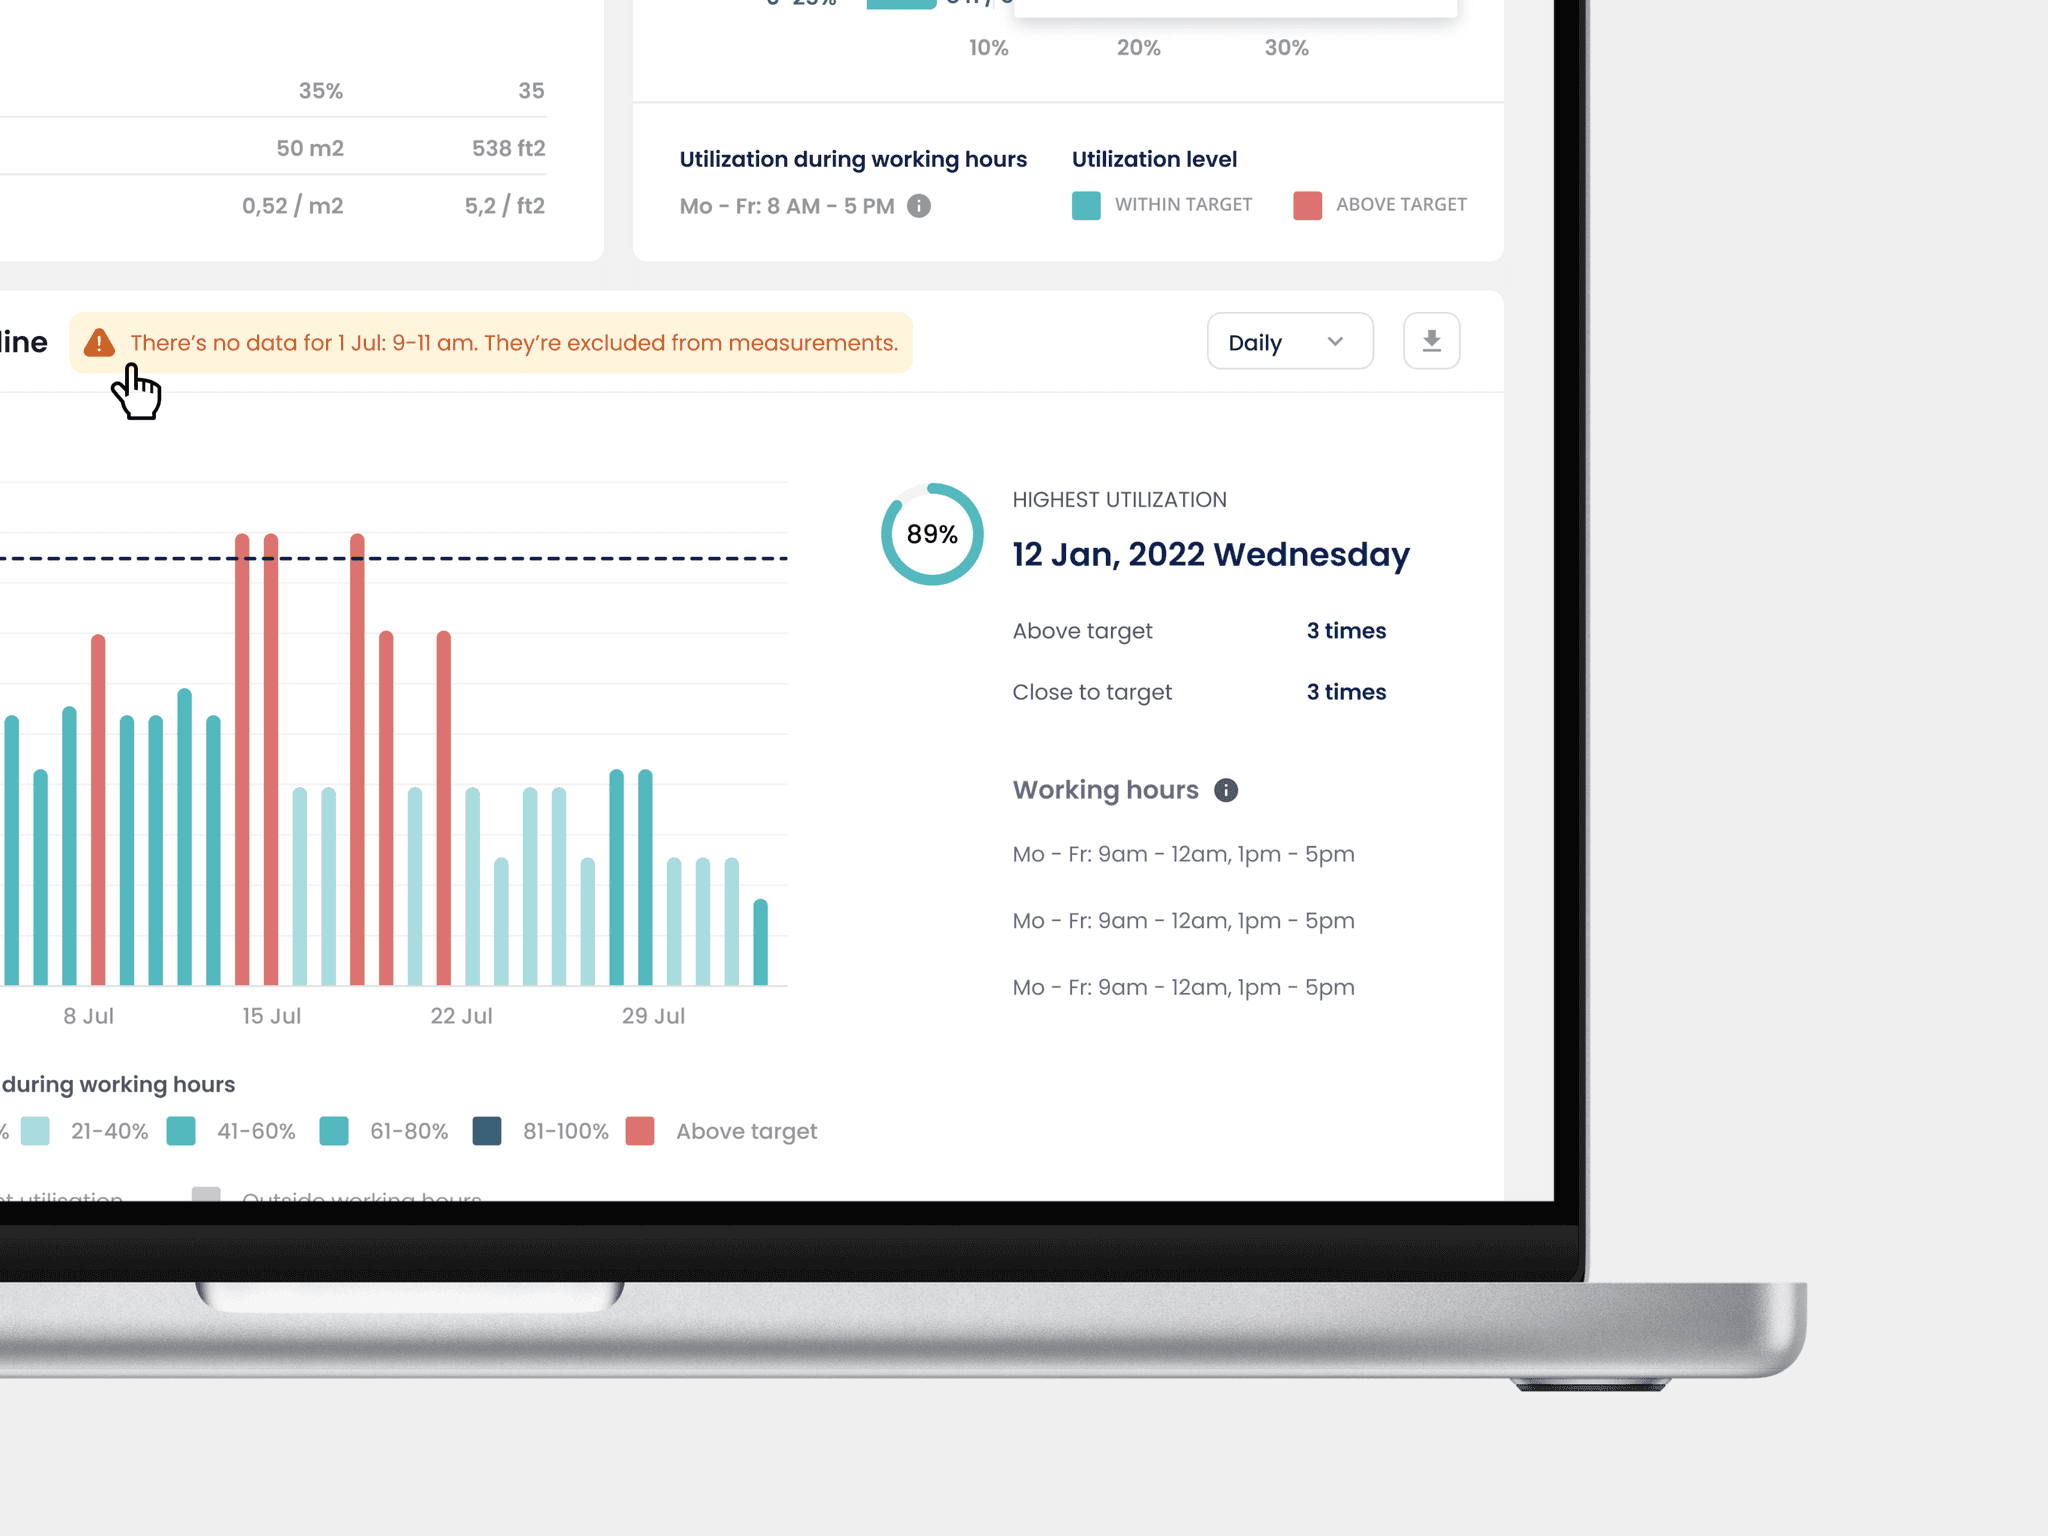
Redesigned data presentation with contextual insights, guided recommendation panels, and simplified visualization hierarchy. Added interpretation guidance and improved sharing capabilities.
Result
Time to implement changes decreased by 37%, support inquiries about data interpretation declined by 45%, and renewal rates improved as customers could better articulate ROI to stakeholders.
Problem
Customers struggled to translate data insights into concrete actions. Users reported "data overwhelm" and uncertainty about how to prioritize information.
Solution
Redesigned data presentation with contextual insights, guided recommendation panels, and simplified visualization hierarchy. Added interpretation guidance and improved sharing capabilities.
Result
Time to implement changes decreased by 37%, support inquiries about data interpretation declined by 45%, and renewal rates improved as customers could better articulate ROI to stakeholders.


Behind the scene
Behind the scene
No flashes, just hard work, phases of chaos & uncertainty, phases of structuring and aha! moments. Days of collaboration & days of individual focus work.


No flashes, just hard work, phases of chaos & uncertainty, phases of structuring and aha! moments. Days of collaboration & days of individual focus work.